Know exactly when to make your move.
We monitor your watchlist for critical shifts in momentum, valuation, and analyst sentiment. Get the ultimate data summary delivered to your inbox, giving you the intelligence to make your own moves with confidence.
Clear Market Signals
Eyeing a new stock? We alert you when a company gets a valuation upgrade or positive earnings revisions, providing the intelligence you need to confidently time your entry.
Definitive Sell Signals
Rule #1 of investing: Don't lose money. We monitor for sudden drops in momentum and analyst downgrades, giving you the early warning needed to cut losses and protect your capital.
Actionable Daily Deltas
No dashboard fatigue. You get a single, concise email detailing only what changed for your specific tickers so you can act immediately.
Personalized Earnings Calendar
Never miss an earnings call again. See exactly when your specific stocks are reporting, mapped out week by week.
Options Income Engine
Turn your watchlist into yield. We scan option chains for the best cash-secured puts and covered calls to sell — tuned to a conservative or aggressive risk profile — and explain the premium, delta, and annualized return in plain English.
Precious Metals Pulse
Keep a read on the safe-haven trade. Live gold and silver spot prices plus options flow sit right beside your portfolio, so you can gauge risk sentiment at a glance.
See what you'll get
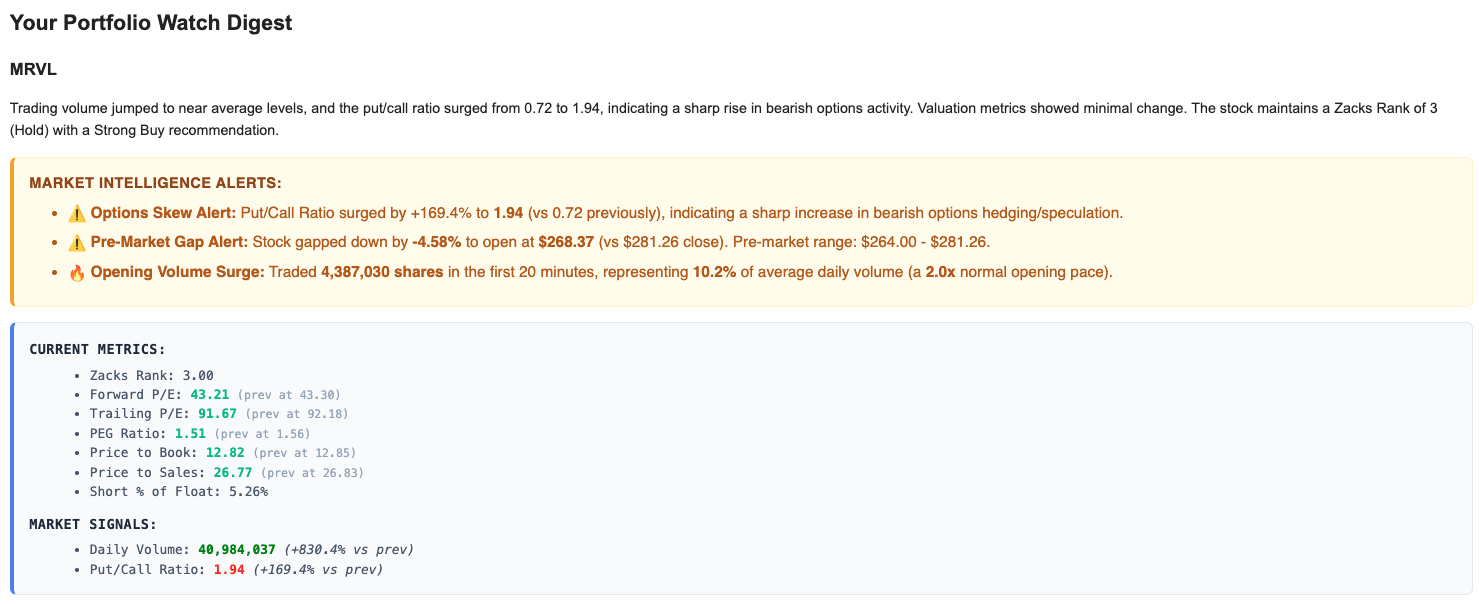
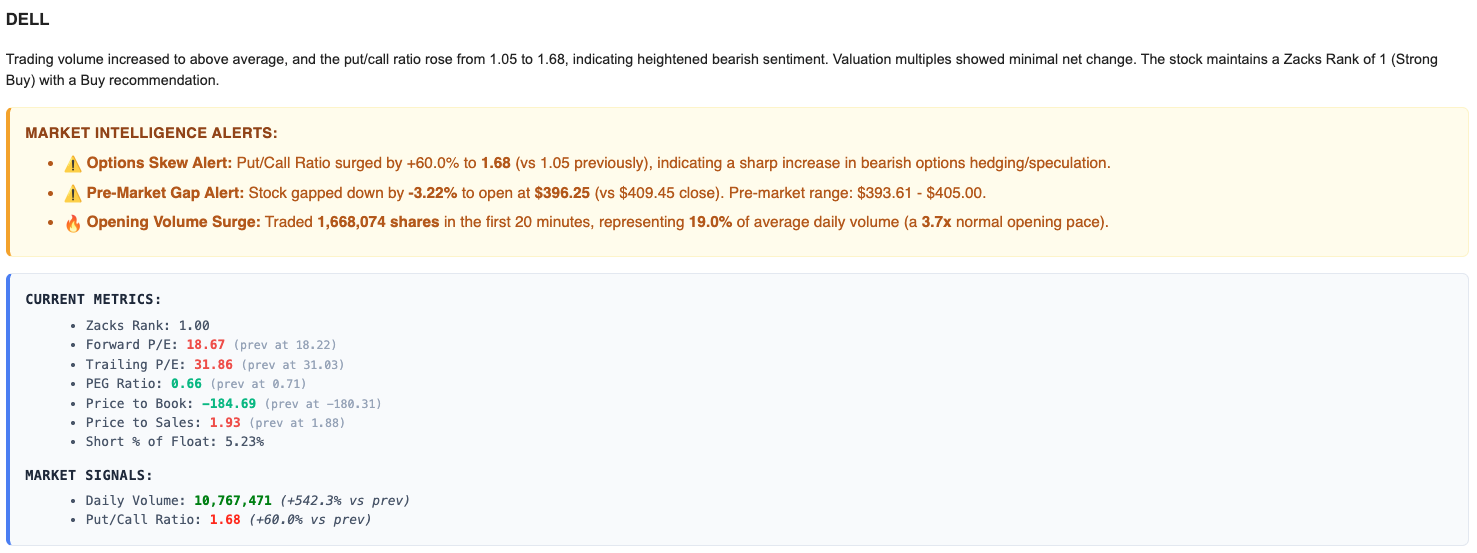
Every morning, you'll receive a beautifully formatted digest combining AI analysis with raw, actionable metrics.
How Every Signal Here Is Calculated
We publish the formula, the thresholds, and the limitations behind each number on this dashboard
A figure you cannot interrogate is a figure you cannot use. Each guide below takes one signal from this page, explains the market concept behind it in plain English, states the exact calculation we apply, and sets out the assumptions that should make you discount it. The limitations are written as carefully as the explanations.
What the Zacks Backtest Actually Measures
The $100-per-day rebalancing rule behind the strategy chart above, and the four biases that inflate the result.
VolatilityReading the VIX and VXN Fear Gauges
Why VXN sits on a higher baseline than VIX, and why an extreme fear reading is not a buy signal.
Options IncomeCash-Secured Puts and Covered Calls
Delta as a probability proxy, why annualized yield overstates reality, and what the screen cannot tell you.
EarningsHow the Implied Earnings Move Works
Deriving the expected earnings reaction from the at-the-money straddle, and why volatility crush punishes the obvious trade.
CommoditiesPrecious Metals Signals and the Gold Ratios
Why gold, silver, and platinum are three different assets, and how to read the ratios without over-trusting them.
TransparencyData & Methodology
Every data source, how often each refreshes, what we store, and an honest list of the known gaps.
New to the terminology? The glossary defines every term used across the site, and the FAQ covers how the service works and what we store.
Important Notice: All content, ratings, charts, and data presented on Portfolio Watch are provided strictly for informational and educational purposes. Nothing on this website constitutes investment advice, financial guidance, or a recommendation to buy or sell any security. Simulated performance is hypothetical and is not indicative of future results. Market investments involve substantial risk of loss. Always perform your own due diligence and consult a licensed financial advisor before making financial decisions.